How to Segment by Stream in Google Analytics 4
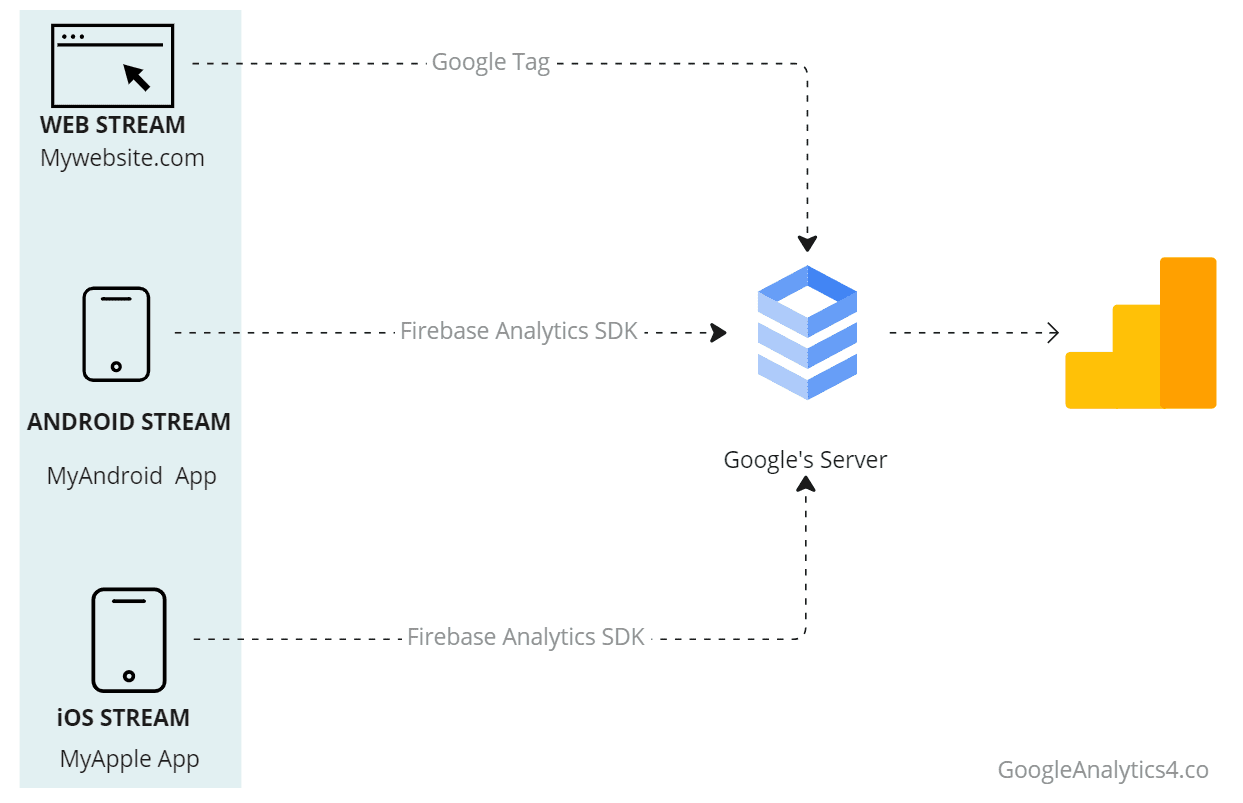
Google Analytics 4 introduced the concept of “Stream”. A stream can be either a website or a mobile application from which we aim to collect data to analyze. For example, if a retail e-commerce business has a website, an android application, and an iOS application. It can set up 3 different streams. We can then analyze web and app data in the same reporting interface.

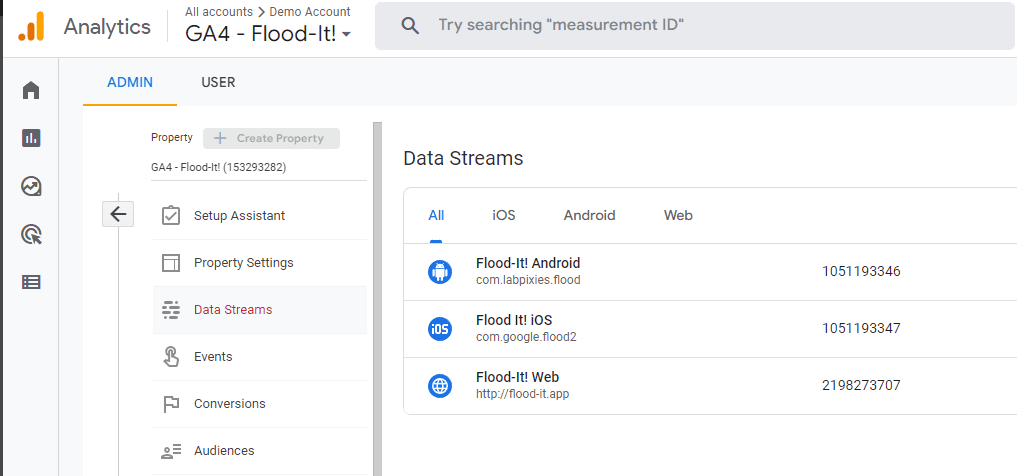
We can see one such configuration in Google’s demo account for GA4. This account has 3 streams configured. Depending on your business and brand structure, you can have either 1 or as many as 50 streams in one analytics property.
Segmenting by Streams
GA4 has two reporting interfaces. Default reports and explorer. If you have more than 1 stream, your data from both streams will display in the streams unless you segment it for a specific stream. We can segment data by specific streams in both reporting interfaces to differentiate between data from different streams.
Segmenting by Streams in Reports
The Reports section contains several default reports. We will take a look at Acquisition Overview Report to understand how to segment by a stream.
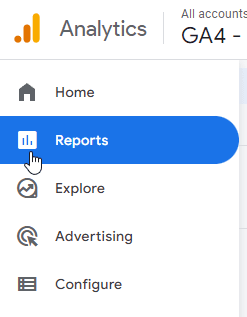
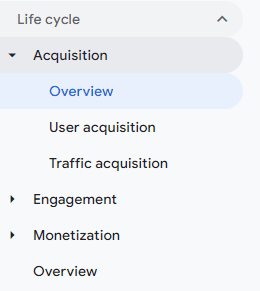
Under the Reports section, go to Life cycle -> Acquisition -> Overview
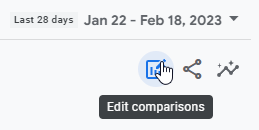
- On the top right, under the date picker, click on the Edit Comparison icon.
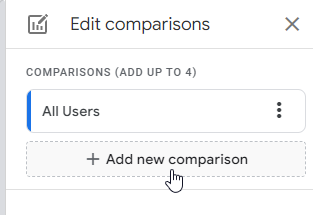
2. Click on Add New Comparison
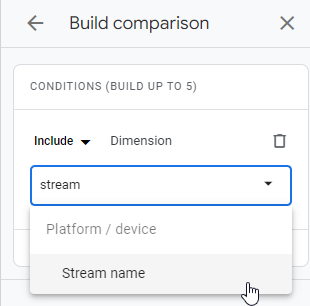
3. In the Conditions panel, search for the Stream name dimension.
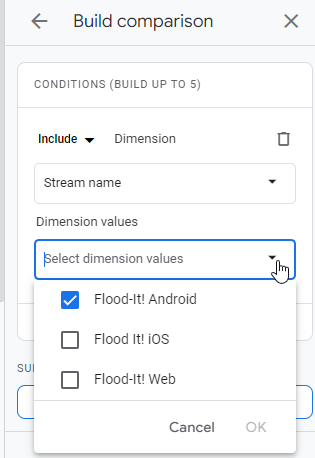
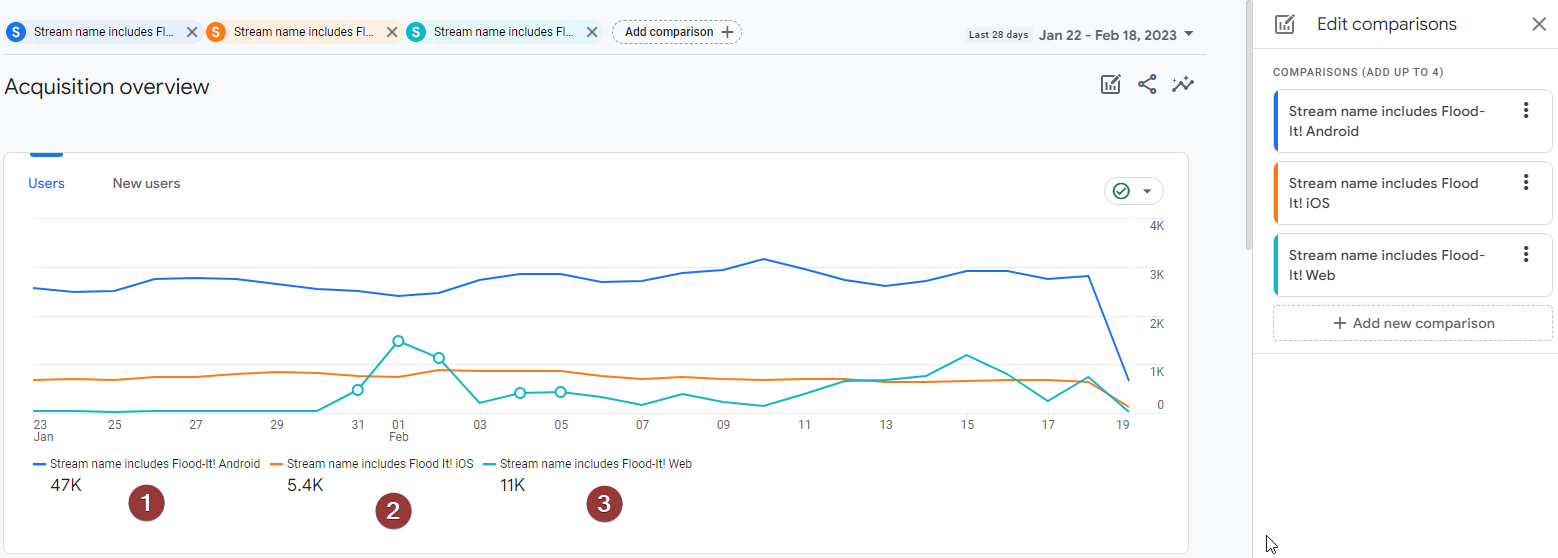
 4. Once you select the Stream name dimension, you will see another input box with Stream values. Select the streams that you want to segment the data for. In this example, we want to compare Android, iOS, and Web users’ stats. Therefore, I will add 3 comparisons.
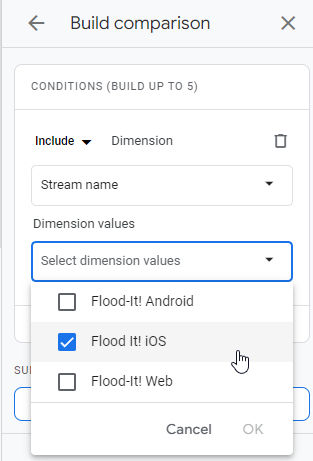
5. Select 1st segment for Android Stream.
6. Select 2nd Segment for IOS
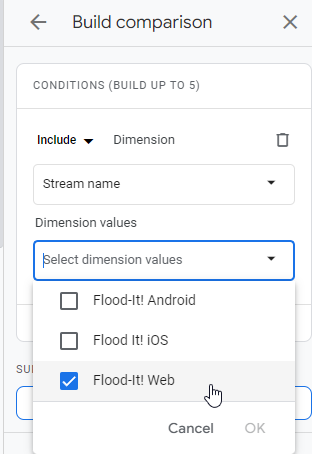
7. Select 3rd Segment for Web
Now that you have selected 3 comparison segments, you can see the data segmented by stream on the acquisition report.
Segmenting by Streams in Explore
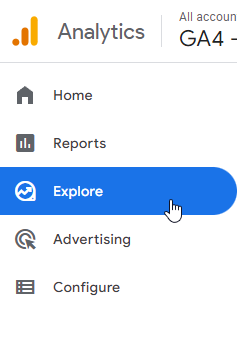
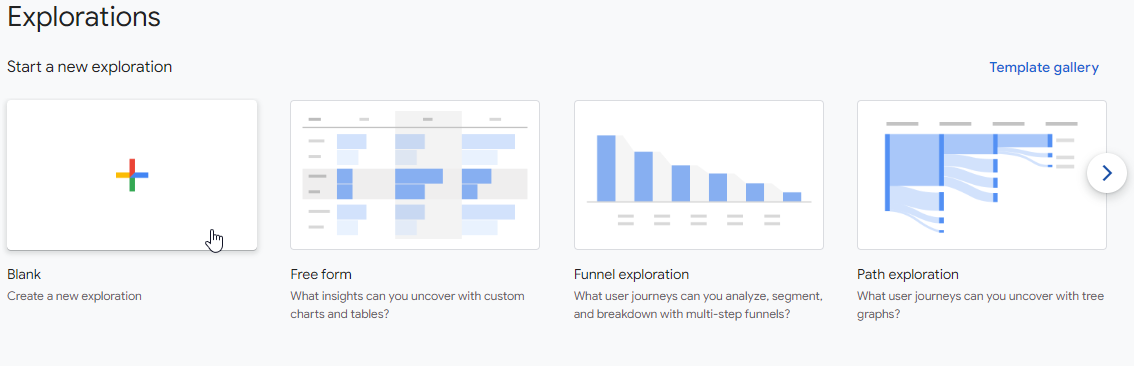
Explore is the other type of reporting available in Google Analytics 4. You can access explore from Home-> Explore.
- Create a new explore report by clicking on Blank + sign.
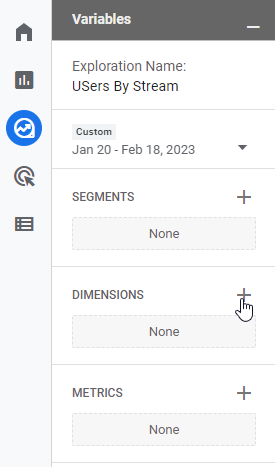
2. We will replicate the same report as we did above to understand how many users our analytics property acquired by each stream. In the screen which opens, I have used the name Users by stream. Click on + Button next to dimensions.
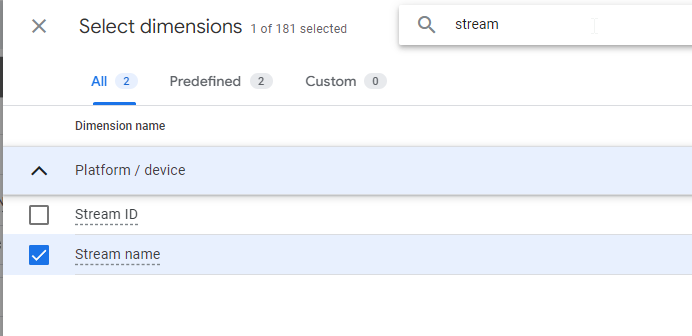
3. Add Stream dimension by searching for dimension Stream Name, select the dimension and click on Import button on top right.
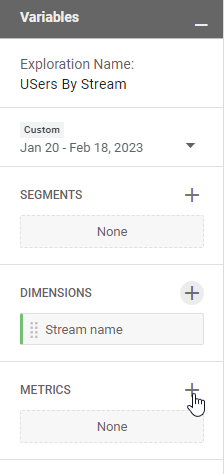
4. Click on the + button next to Metrics.
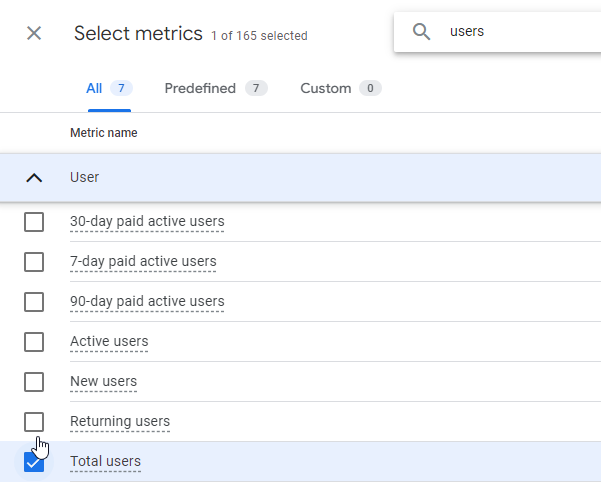
5. Add the Total Users metric by searching for users and selecting Total Users.
6. Draw the graph by first selecting the time series icon under visualization, then drag “Stream name” from dimension into Breakdowns, and finally drag Total users from Metrics into Value.
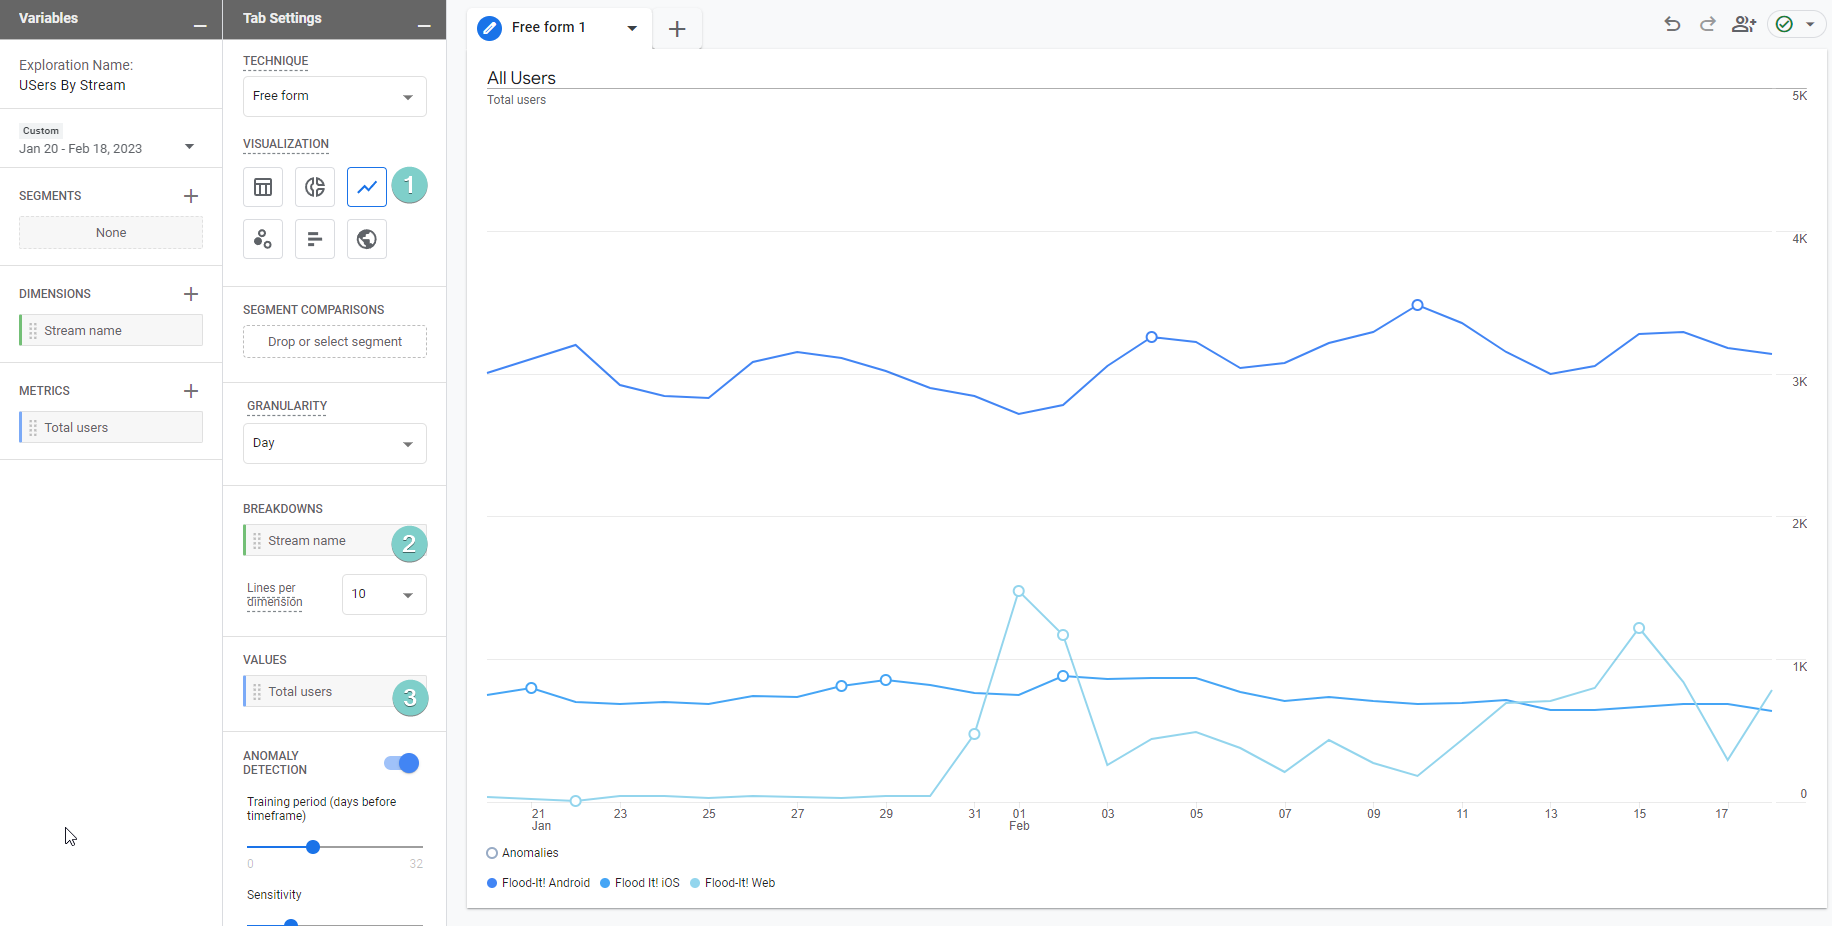
This is our final result of segmenting Users by Stream name using explore reporting.
Responses