Market Basket Analysis in Google Analytics 4
Market Basket analysis is used to uncover patterns and association between products that customers frequently purchase together. One popular use case for Market basket analysis is product recommendation. By finding association between products which are frequently purchased together, we can predict which products customers may also like to consider when they add products to cart. Recommending these predicte products to website visitors therfore increases our cross-sell opportunities.
In this article, we will explore how we can recommend products to website visitors. The basic idea is to use association rule for finding products which are frequently bought together in historical transactions. Market Basket analysis can be done by finding product level patterns or category level patterns. Product level patterns imply if a customer bought a product , how frequently did she buy some other products. Category level pattern however finds which categories’ products are customer more likely to buy together. In this article, we will use association rule for finding category level pattern.
Here are the steps we will follow:
- Get transaction data with categories from Google Analytics 4 BigQuery Data set.
- Restructure the data for creating matrix and eliminate unwanted anamolies.
- Create 1-hot encoded matrix for transactions & product categories.
- Find frequently occuring itemsets using Apriori algorithm in MLxtend(Python).
- Generate Association rules using MLxtend.
- Intuitively understand meaning of Association rules.
Get transaction data from GA4
For this article, we are using Google Analytics 4 demo data set publicy available here. If it is first time that you are using Python to connect to BigQuery, I will recommend going through introductory article for getting data from BigQuery using Python. There is 12 months of data available, for this article, I am only getting first 6 months of data between 1st January 2021 and 30th June 2021.
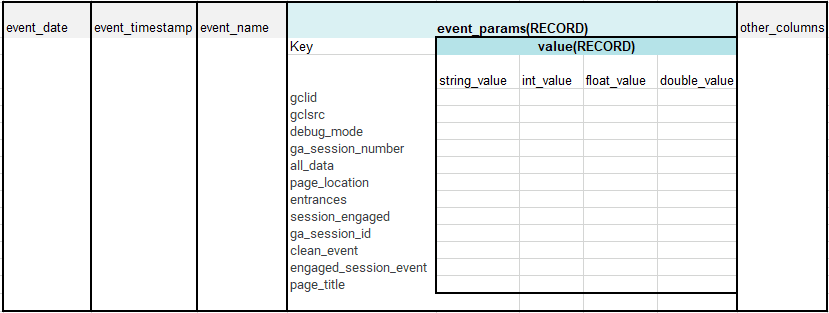
We want to build associations between products purchased in transactions and their associated categories. In Google Analytics 4 a purchase event from nested record field “event” indicates when a succesful purchase has occured. The purchase event also contains transaction Id as key,value pair. Product Id and product category information is available in item field. Therefore, we will join purchase event with unnested transaction Id and item category on common field of event_date and event_bundle_squence_id.
Resulting data set will have product skus and item categories for each transaction in a single row, however, joined together with a “,”.
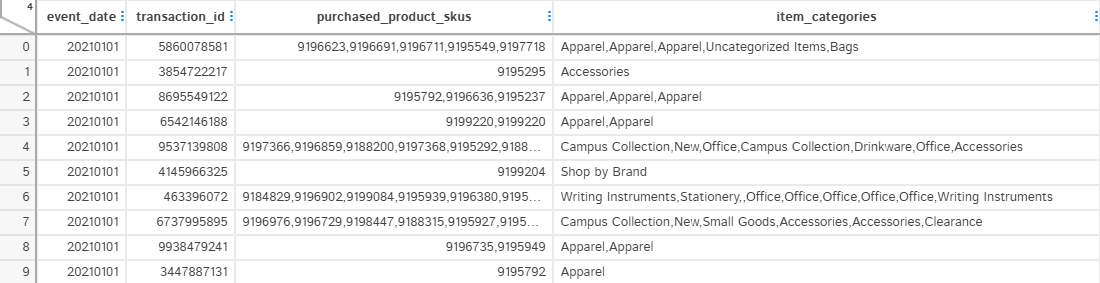
The SQL query to directly retrieve data from BigQuery is given below.
SQL Query for extracting Data from GA4
--Extracting Transactions and products brought together in the transactions from Google Analytics 4 dataset.
WITH transactions AS (
  SELECT
    event_date,
    event_bundle_sequence_id,
    event_parameters.key AS event_key,
    event_parameters.value.string_value AS event_value
  FROM
    `bigquery-public-data.ga4_obfuscated_sample_ecommerce.events_*`,
    UNNEST(event_params) AS event_parameters
  WHERE
    event_name = 'purchase'
    AND event_parameters.key = 'transaction_id'
    AND _TABLE_SUFFIX BETWEEN '20210101' AND '20210630'
)
,items AS (
  SELECT
    event_date,
    event_bundle_sequence_id,
    items.item_id AS purchased_product_skus,
    items.item_category AS item_categories
  FROM
    `bigquery-public-data.ga4_obfuscated_sample_ecommerce.events_*`,
    UNNEST(items) AS items
  WHERE
    _TABLE_SUFFIX BETWEEN '20210101' AND '20210630'
)
,joined_data AS (
  SELECT
    t.event_date,
    t.event_value AS transaction_id,
    i.purchased_product_skus,
    i.item_categories
  FROM
    transactions t
  JOIN
    items i
  ON
    t.event_date = i.event_date
    AND t.event_bundle_sequence_id = i.event_bundle_sequence_id
)
SELECT
  event_date,
  transaction_id,
  STRING_AGG(purchased_product_skus, ',') AS purchased_product_skus,
  STRING_AGG(item_categories, ',') AS item_categories
FROM
  joined_data
GROUP BY
  event_date,
  transaction_id
ORDER BY
  event_date
Let us jump into the Python code now. We need to import a few libraries for connecting to BigQuery, handling data frames etc. I have created a helper.py file to create a few utility functions. This will keep our code neat. get_datafram() is a custom function defined in helper.py file. It stores the query result in CSV when query is run for the first time. It only refreshes the query result only when you change the file name in csv_file variable. Using this approach avoids multiple times querying cost when I am playing with data, also for users who do not want to connect to BigQuery can simply use the csv file to run through this excercise.
import os
import pandas as pd
from google.cloud import bigquery
from mlxtend.frequent_patterns import apriori
from mlxtend.frequent_patterns import association_rules
from helpers import set_values_to_binary,get_dataframe,show_dtale
import dtale

# Set the path to the JSON credentials file
os.environ['GOOGLE_APPLICATION_CREDENTIALS'] = 'Auth/retail-ga4-dataset-76ffc0b63205.json'

# Initialize the BigQuery client
client = bigquery.Client()

# Set your project, dataset, and table prefix
project_id = 'bigquery-public-data'
dataset_id = 'ga4_obfuscated_sample_ecommerce'
#table_prefix = 'events_20210131'

# Store results of query in CSV file to avoid re-querying when writing the program.
csv_file="query_result.csv"

# Write  SQL query using the wildcard table feature
# Write your SQL query using the wildcard table feature and date range filter
sql_query = f"""
WITH transactions AS (
  SELECT
    event_date,
    event_bundle_sequence_id,
    event_parameters.key AS event_key,
    event_parameters.value.string_value AS event_value
  FROM
    `{project_id}.{dataset_id}.events_*`,
    UNNEST(event_params) AS event_parameters
  WHERE
    event_name = 'purchase'
    AND event_parameters.key = 'transaction_id'
    AND _TABLE_SUFFIX BETWEEN '20210101' AND '20210630'
)

,items AS (
  SELECT
    event_date,
    event_bundle_sequence_id,
    items.item_id AS purchased_product_skus,
    items.item_category AS item_categories
  FROM
    `{project_id}.{dataset_id}.events_*`,
    UNNEST(items) AS items
  WHERE
    _TABLE_SUFFIX BETWEEN '20210101' AND '20210630'
)

,joined_data AS (
  SELECT
    t.event_date,
    t.event_value AS transaction_id,
    i.purchased_product_skus,
    i.item_categories
  FROM
    transactions t
  JOIN
    items i
  ON
    t.event_date = i.event_date
    AND t.event_bundle_sequence_id = i.event_bundle_sequence_id
)

SELECT
  event_date,
  transaction_id,
  STRING_AGG(purchased_product_skus, ',') AS purchased_product_skus,
  STRING_AGG(item_categories, ',') AS item_categories
FROM
  joined_data
GROUP BY
  event_date,
  transaction_id
ORDER BY
  event_date
LIMIT 20
"""
result = get_dataframe(csv_file,sql_query)
Restructure the data
To create a 1-hot encoded matrix in the next step, we will need to restructure the data. Since, we are doing this analysis at category level. We want 1 row per category, so that we can create a 1-hot encoded matrix from it.
There are also two problems with the data. One of the category is called “New” and some of the product_skus do not belong to any category. We can remove both of these categories by filtering using .loc[] function of Pandas data frame.
After restructuring the data, we have multiple rows for a transaction_id because we are interested in unique row values of item_categories.
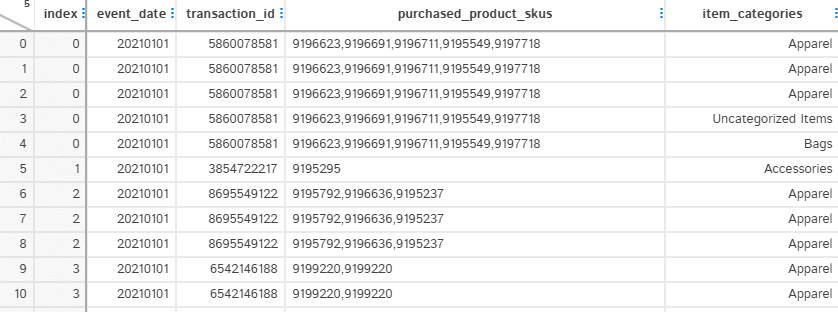
The following Python code helps us in achieving our result above.
# Split item_categories into separate rows
raw_split_categories = result.assign(item_categories=result["item_categories"].str.split(",")).explode("item_categories")

# raw_split_categories.loc[...]: The .loc[] accessor is used to select rows from the DataFrame based on the boolean conditions within [].
# some of the transactions had items which did not belong to any categories. Removing any such rows where there is no category and where category =New

split_categories = raw_split_categories.loc[(raw_split_categories["item_categories"] != "") & (raw_split_categories["item_categories"] != "New")]
Create 1-Hot encoded Matrix
To recap, our objective is to find out categories which are frequently brought together. We want to find these frequent patterns using Apriori algorithm from MLxtend Library. The function expects 1-Hot encoded Matrix for variable of interest. Therefore, we will convert the above structure to 1-Hot encoded data.
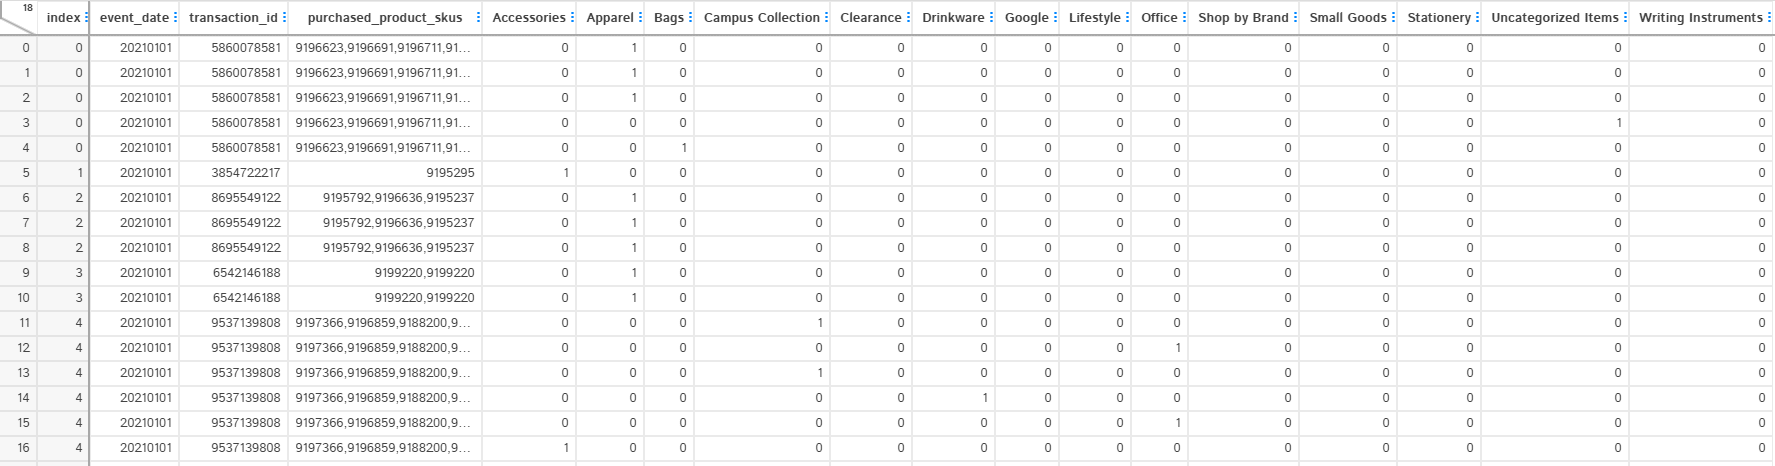
we use get_dummies function to generate the above one-hot-encoded matrix. The value is not necessarily binary ( 0,1) here, because we will get more than 1 if the item occured in a category more than once in a transaction. Therefore, we use a helper function to convert values to binary.
# One-hot encode the item_categories
one_hot_encoded = pd.get_dummies(split_categories, columns=["item_categories"], prefix="", prefix_sep="")

# Group by transaction_id and aggregate the rows
result_encoded_grouped = one_hot_encoded.groupby(["event_date", "transaction_id", "purchased_product_skus"], as_index=False).sum()

result_binary = result_encoded_grouped.copy()
result_binary[result_binary.columns[3:]] = result_encoded_grouped.iloc[:, 3:].applymap(set_values_to_binary)
Find Frequent itemsets
We want to find itemsets where similar product categories pattern occur in transactions. For that we will use apriori() function of MLxtend. It gives us back data frame for supported itemsets.
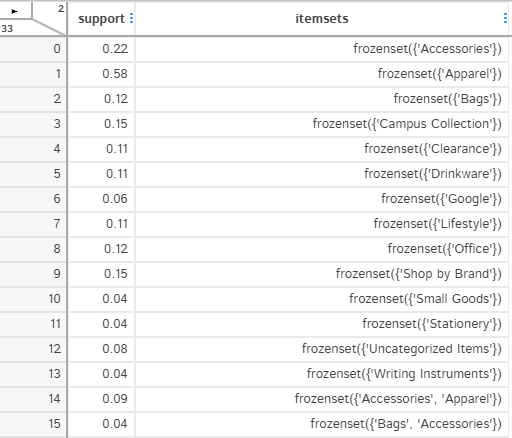
I have chosen a support level of 0.10 in the code below. What that implies is that only consider those itemsets where proportion of transactions containing these itemsets is higher than 10%(0.10).
#Generate frequent item sets that have a support of atleast 3%
# Pass only the one-hot encoded columns to the apriori() function
supported_itemsets = apriori(result_binary.iloc[:, 3:], min_support=0.03, use_colnames=True)
Generate Association rules
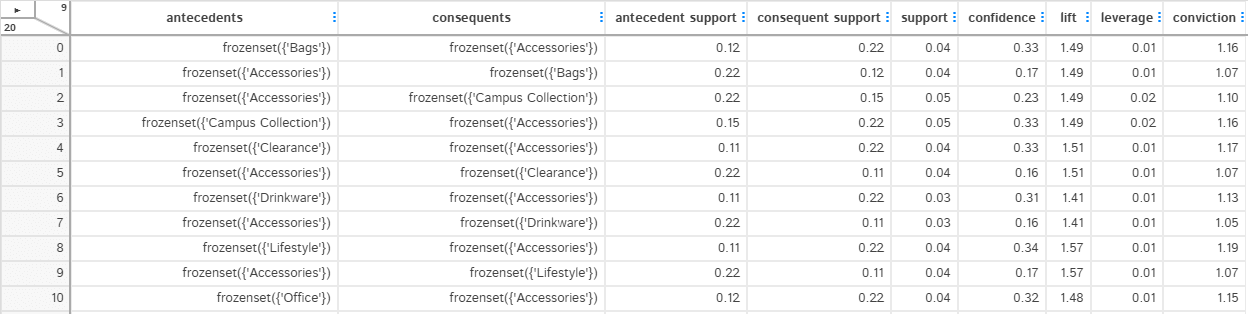
We can now use association_rules function to see the metrics. In he next section, we will explore what each of these metric intuitively mean.

Understanding the rules
The tricky part is to interpret the data and make it useful for business and its customer. Let us go through one single association rule to understand what each of these metrics mean intuitively.

antecedents: This is the “if” part of the rule. In this case, it is the set containing ‘Accessories’. It represents that the customer has purchased ‘Accessories’.
consequents: This is the “then” part of the rule. In this case, it is the set containing ‘Campus Collection’. It represents that the customer has also purchased ‘Campus Collection’.
So, the rule can be read as: “If a customer purchases Accessories, then they are also likely to purchase Campus Collection.”
Now, let’s look at the metrics associated with the rule:
Antecedent support:
This is the proportion of transactions in the dataset that contain the antecedent item(s). In this case, it’s 0.3, which means that 30% of transactions include ‘Accessories’.
Consequent support:
This is the proportion of transactions in the dataset that contain the consequent item(s). In this case, it’s 0.1, which means that 10% of transactions include ‘Campus Collection’.
Support:
This is the proportion of transactions in the dataset that contain both the antecedent and consequent items. In this case, it’s 0.1, which means that 10% of transactions include both ‘Accessories’ and ‘Campus Collection’.
Confidence:
This is the probability of the consequent item(s) being purchased given that the antecedent item(s) were purchased. In this case, it’s 0.333333, which means that there is a 33.33% chance that a customer who purchases ‘Accessories’ will also purchase ‘Campus Collection’.
Lift:
This is the ratio of the rule’s confidence to the expected confidence if the antecedent and consequent items were independent. In this case, it’s 3.33333, which means that the rule is 3.33 times more likely to occur than if the items were unrelated. A lift greater than 1 indicates that the items have a positive relationship, meaning they are likely to be purchased together.
Leverage:
This measures the difference between the rule’s support and the expected support if the antecedent and consequent items were independent. In this case, it’s 0.07, which means that the occurrence of this rule is 7% higher than expected if the items were unrelated.
Conviction:
This is a metric that indicates the degree to which the antecedent item(s) depend on the consequent item(s). In this case, it’s 1.35, which means that the rule would be incorrect 1.35 times more often if the association between the antecedent and consequent items was purely random. A conviction value greater than 1 indicates a meaningful relationship between the items.
In summary, the association rule suggests that there’s a positive relationship between the items ‘Accessories’ and ‘Campus Collection’. Customers who purchase ‘Accessories’ are 33.33% more likely to purchase ‘Campus Collection’ as well, and this relationship is 3.33 times stronger than if the items were unrelated.
Github Repo
You can download the complete code for this article from this GitHub repository.
Summary
We explored Market Basket analysis to find out association rules for products bought together in transaction database from Google Analytics 4. We connected to BigQuery , extracted and pre-processed the data and converted it into 1-Hot encoded data. This 1-hot encoded data was then passed to generate association rules using MLxtend association rules function. In the end, we briefly wrote intuitive description of what each of the metrics of association rule mean.
Great article, Can you provide a link to the complete code for this activity?
Nice job! I would greatly appreciate perhaps a github repo with access to this project!
I have updated the article with the GitHub code. You can download the code now.