Reports in Google Analytics 4
Google Analytics 4 provides 3 modes for exploring and analyzing your data
- Reporting Hub – Default
- Analysis Hub – Explore mode.
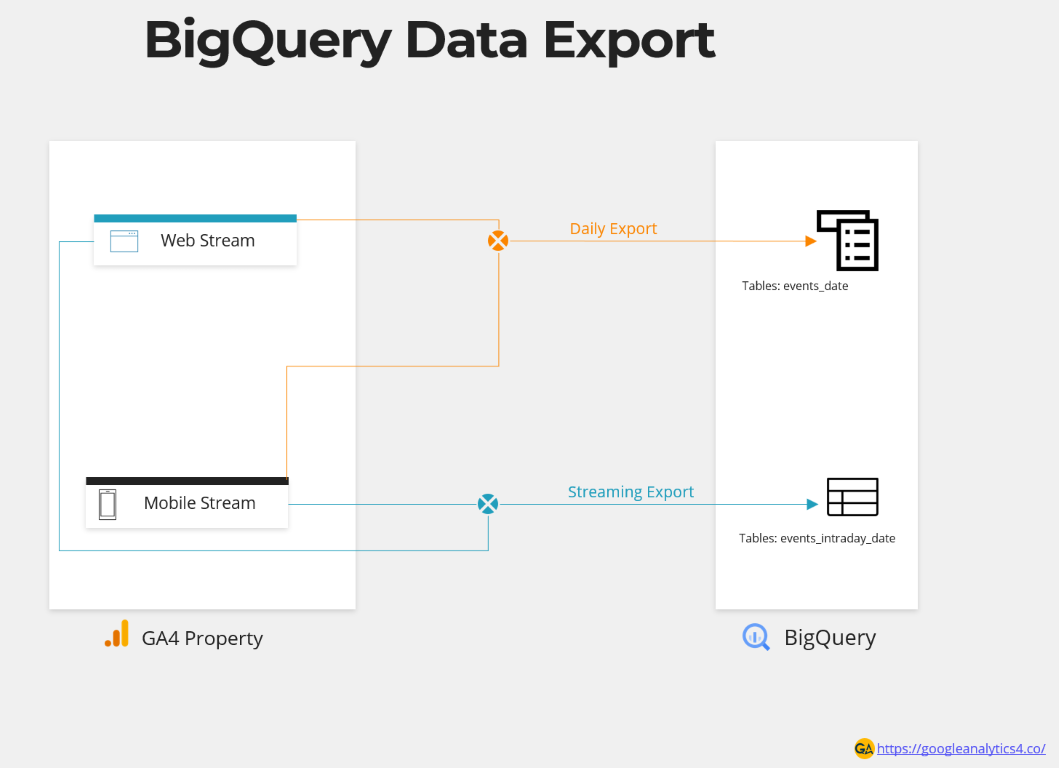
- Raw Data using BigQuery.
In this article, we will explore what is reporting hub is and what options it provides for viewing and manipulating data in Google Analytics 4.
Reporting Hub – Default Reports
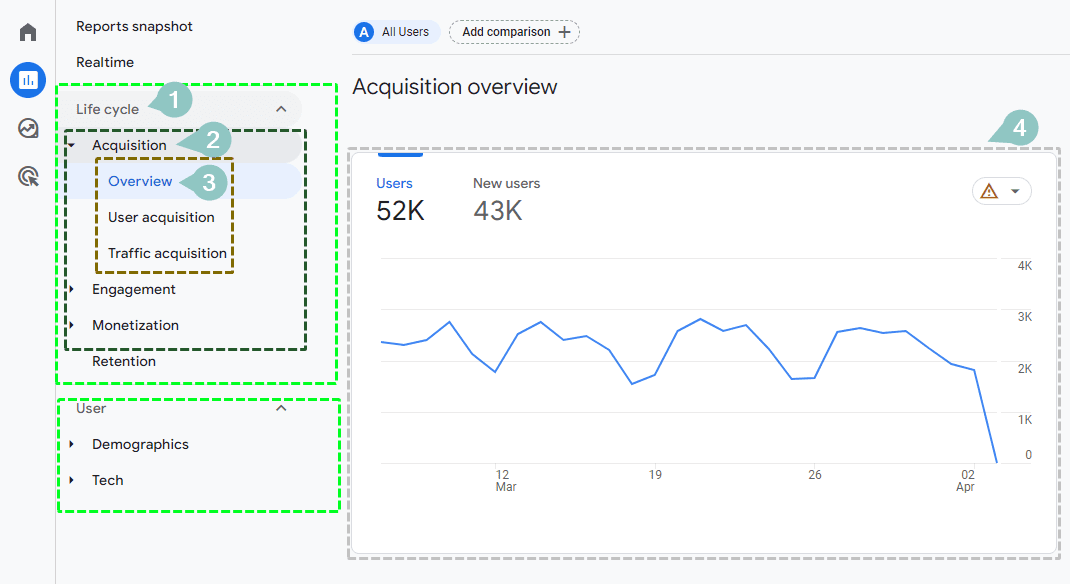
Reporting Hub is the default reporting interface in Google Analytics 4. When you log in to GA4 interface and click on the Reports button in the left navigation, it opens the reporting hub. It contains a set of reports organized in a hierarchy of collections and topics.
1. Collection
A collection contains a set of reports. It’s the outermost layer of organization for GA4 reports. By default, Life cycle and User collections are included when we log in to the GA4 interface. Each property can have up to 7 collections.
2. Topics
Topics are a subset of reports within Collections. One way of thinking about topics is to think of a folder within collections to organize reports. E.g. The Life Cycle collection has 4 topics namely Acquisition, Engagement, Monetization, and Retention.
3. Reports
A report is a page within a Topic, which contains a set of cards. These cards can be charts, tables and comparisons. These cards show data collection from websites and apps. All reports are organized within collections and topics other than Real-time report and Reports snapshot. Each property can have up to 150 custom reports.
4. Realtime and Report snapshot
On top of Reporting hub, we have two special reports. Reports snapshot and Realtime report. Reports snapshot is the overview report which is displayed when you click on the “Reports” button in the left navigation. It is a customizable report and can be tailored to show the data that you are most interested in on a daily basis. Real-time report is a special report which shows live data from the website.

Reporting Library
Reporting library, keeps an inventory of all reports, collections, and topics. To start customizing the collections and topics, we begin by exploring the library. You need to have at least an Editor Role to access the library. Once you have a proper role, you can click on the Library button on the bottom left within the Reporting Hub. i.e. Reports->Library.
The Library contains two main sections
- Collections: This section shows all the collections available in your reporting interface. It also gives a button to create a new collection.
- Reports: The reports section contains a list of all the reports. Like the collection, it also has a button to start building new reports.
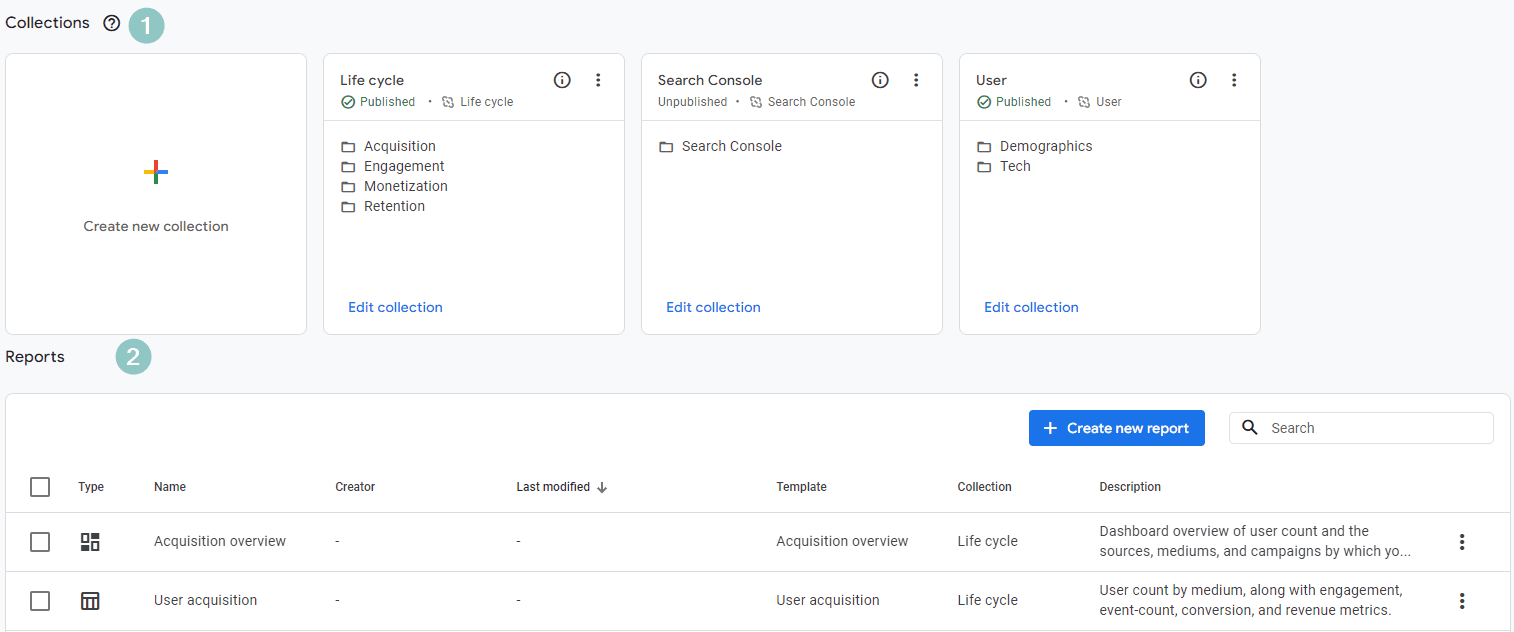
Collections
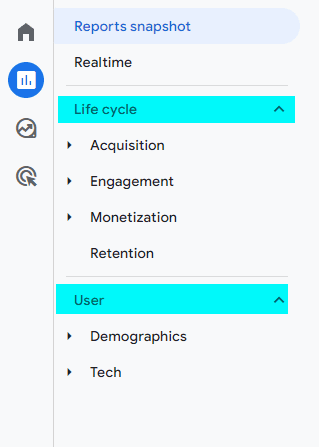
A collection is a set of reports. You can also think of collections as an organization folder for Topics. Collection appears in the left-side navigation of Reporting Hub. In the image below, both the Life Cycle and User collections are default collections that appear in all Google Analytics 4 properties.
Creating Collections
In addition to default collections, we can create new collections in Google Analytics 4. Let us create a collection for marketing topics to see how can we create collections.
From Library -> Collections -> Create New Collection
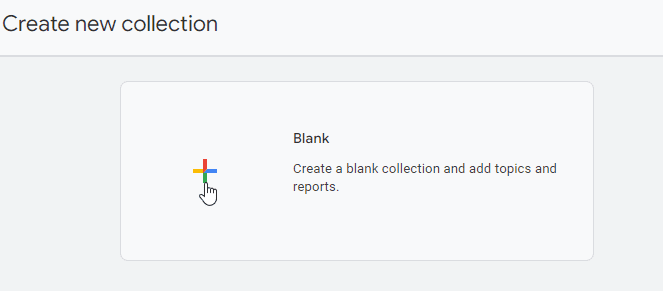
Once you click on create a new Blank collection button, you can choose name of the collection and which Topics will go under this collection.
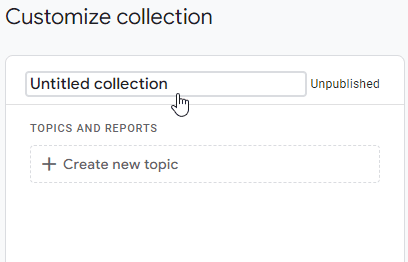
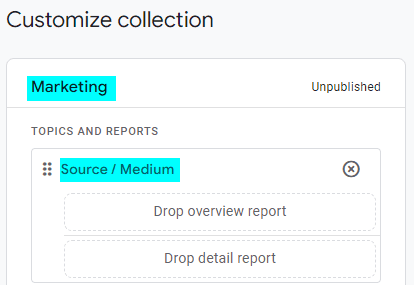
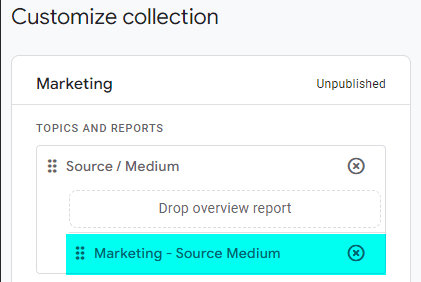
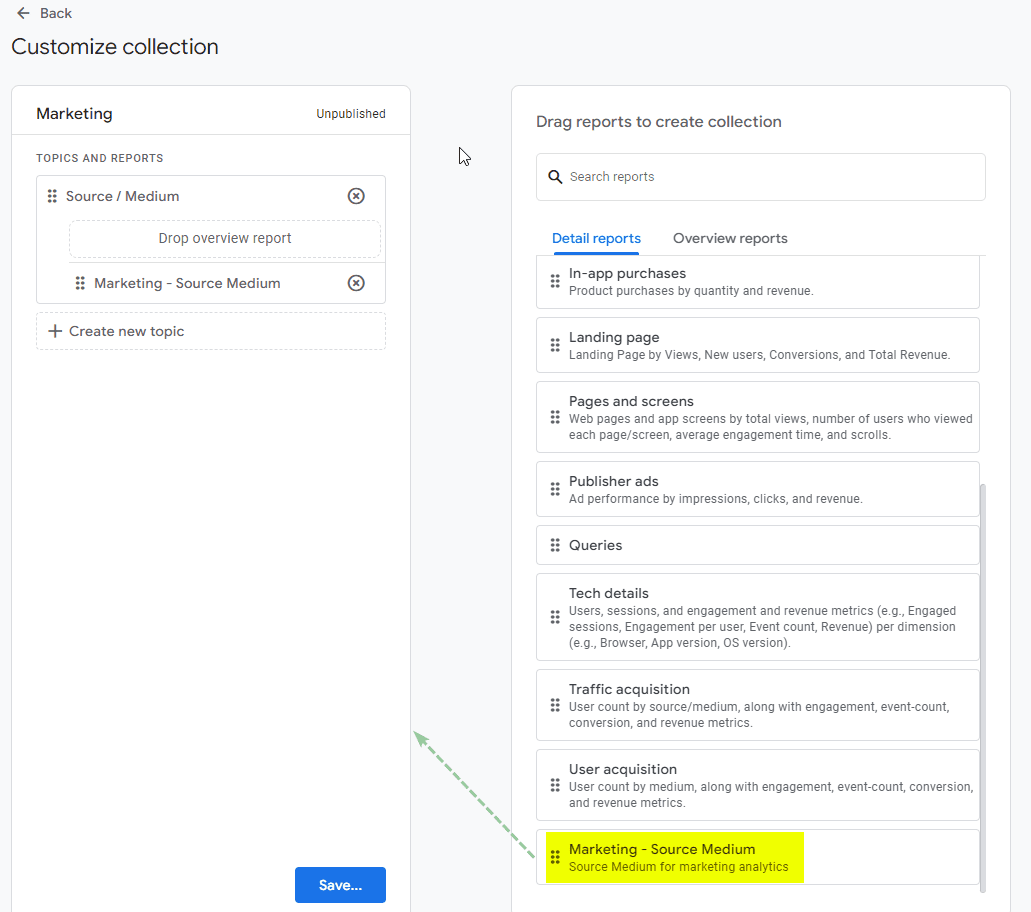
The interface is quite flexible as it allows you to drag and drop the report from the right-side panel to the collection panel.
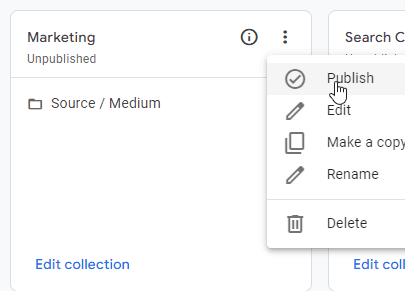
Publishing Collection
A new collection will not appear in the main navigation until it is published. You can publish the collection by visiting the Library and browsing to Collections section. Click on the settings menu option on the collection you want to publish and hit publish.
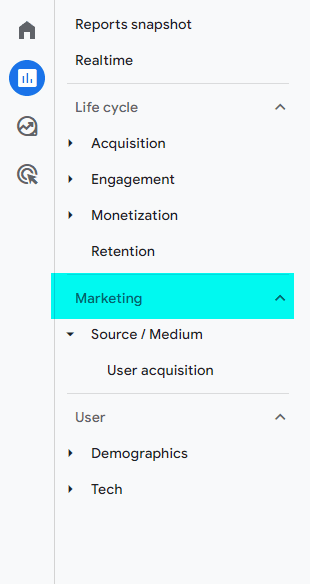
Once the collection is published, it will appear in the Reporting Hub main interface navigation. As you can see in the image below our collection Marketing with the topic Source / Medium having a User Acquisition report is now visible in our main navigation.
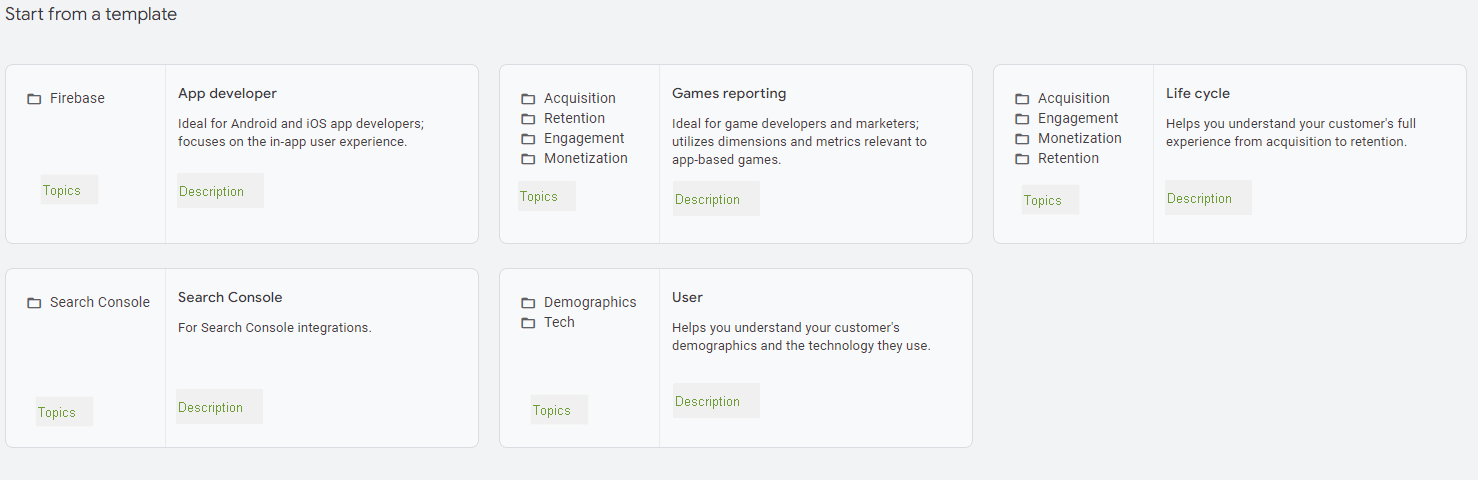
Collection templates
Connection templates are pre-defined reports hierarchies giving you a starting point to start building your own. When you click on create a “new collection”, you have the option to start from templates. The left side of the template card shows the topics pre-built in the collection, the right side shows its description. Once you select a template, the rest of it is just changing topics or reports to suit your business needs.
Reports
Google Analytics 4 has two categories of reports. First is Overview Reports and the second category is Detail Reports
Overview Reports
An overview report is a summary report for detailed reports. You can use only 1 overview report for a Topic and several other detail reports. E.g. If a Topic has 5 detail reports, you can have only an overview report, which will summarize the 5 detail reports.
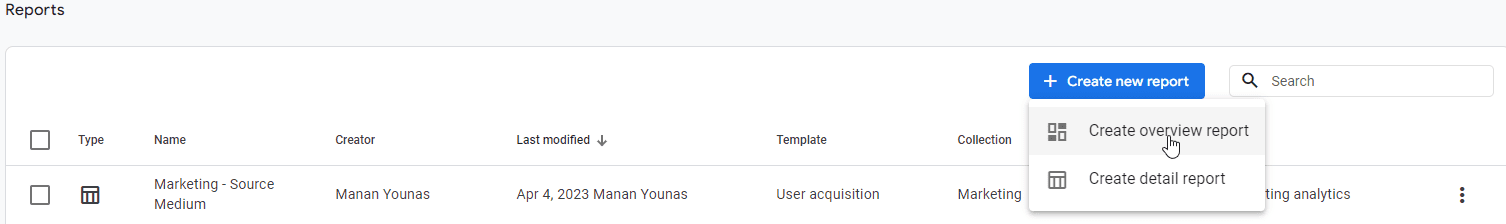
Creating an overview report
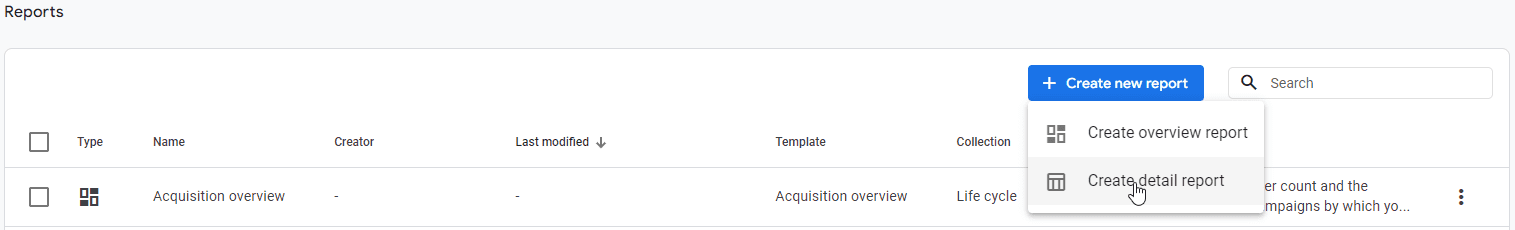
We can create an overview report by clicking on Create new report button from Library-> Reports section.
An overview report only lets you select from pre-defined cards. ( In contrast, a detailed report allows you to create tables and charts). These pre-defined cards are created automatically when you create tables and charts in detailed reports.
There are two categories of cards.
- Summary cards: These cards are created automatically when you create a detailed report in a Topic within a Collection.
- Other Cards: These cards are not directly linked to topics and collections. These are pre-built data cards that you can use in your overview reports.
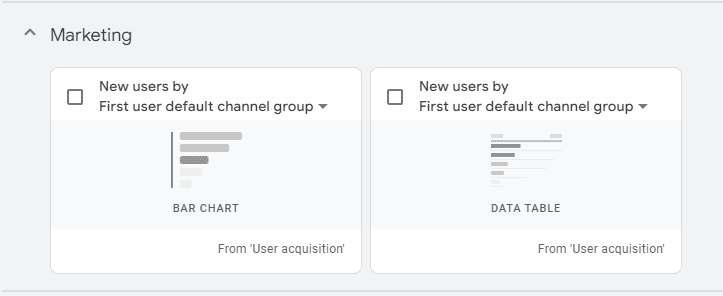
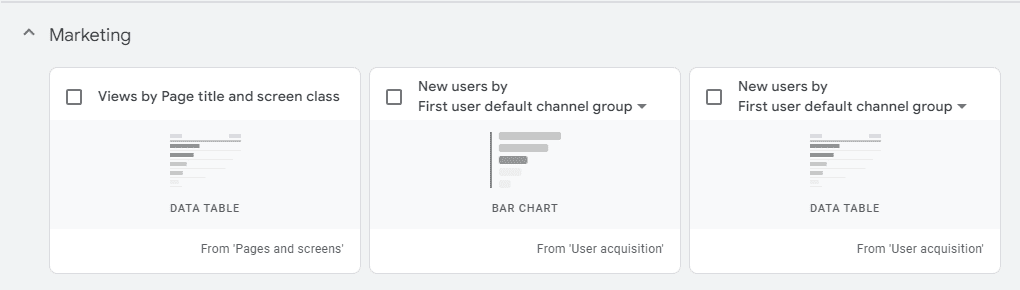
For example, we created a collection of Marketing – Source Medium, which has one detailed report of User Acquisition. Therefore, the only cards available under the marketing sections were New users(Left image below). However, I then went back and added another detailed view report(Pages and screen), which created another automatic card of views by page title and screen class.
The rationale of having automatic cards is most likely to avoid scope creep and provide harmony between overview and detailed report.
Detail Reports
A detailed report shows data for one or two dimensions. It can have up to two visualizations and a table.
Creating a detailed report
We can create a new detail report from the Library by clicking on Create new report in the Reports Section.
We can either create a blank report or choose from pre-existing templates. For this example, I will start with a template of User Acquisition. Further details of how to create detailed reports are covered in this article.
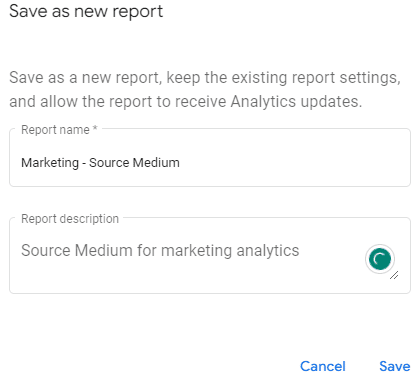
For this report, I have taken the template of User Acquisition and changed the default dimension (Highlighted in yellow) from Channel to source/medium.
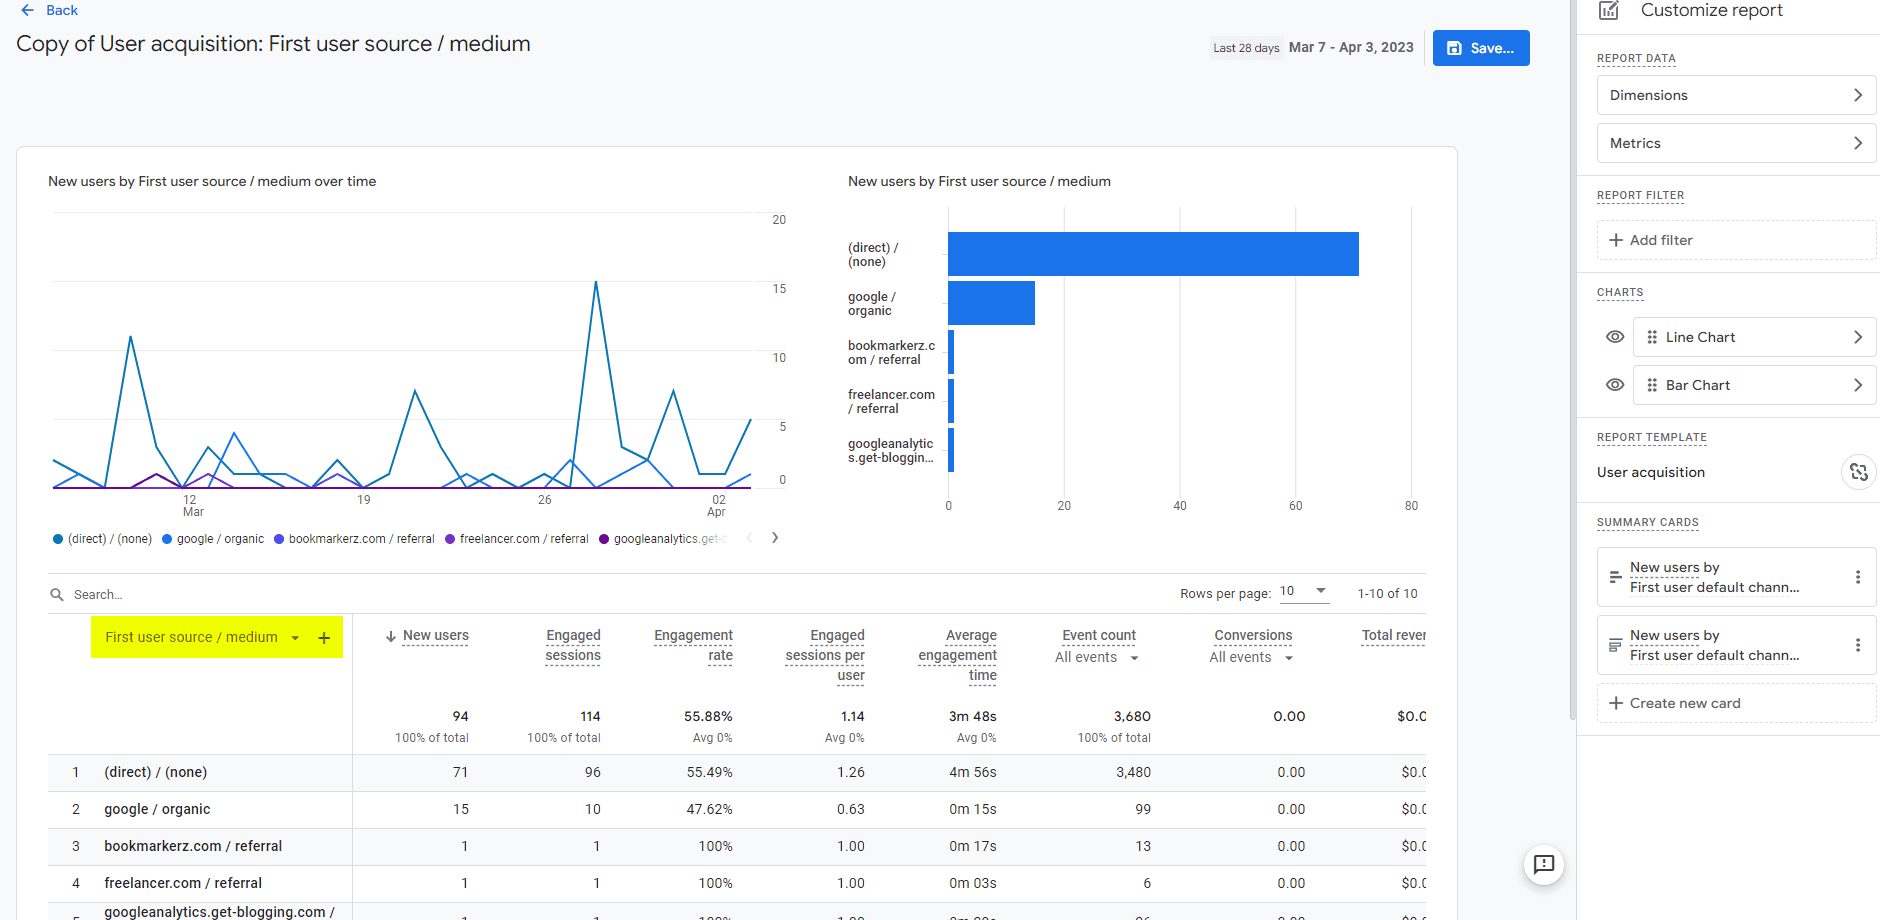
Hitting the save button will prompt you for saving the report and choosing a name.
Once the report is saved, it will appear in Library. From Library, we can add it to a topic within a collection.
Summary
Google Analytics 4 provides 3 ways of exploring data. In this article, we had a look at how reports are organized using Collections and Topics. Each property can have up to 7 collections. A collection changes the navigation in reporting hub interface. A collection contains Topics which are folders to organize reports. GA4 provides two types of reports, an overview report and a detailed report. Each topic can have one overview report and as many detailed reports. Overview reports provide cards for creating a high-level overview of reports, whereas detailed reports provide much more flexibility for creating charts, graphs, and tables.
Responses